Distance vs Time or Displacement vs Time or Position vs Time
- The slope always represent the speed on a distance vs time graph.
- High slope = faster speed
- Low slope = slower speed
- A straight line means constant speed
- slope = rise/ run = 5/2 = 2.5 m/s = constant speed
- slope = 5 m/ 2 s = 2.5 m/s
Example:
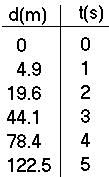
If a rock is dropped from a high cliff. The rock fall for 5 sec, how far did it traveled?
d = si*t + (1/2)a t^2 si = 0 (initial speed) t = 5s a = 9.8 m/s^2
d1 = 1/2 (9.8) (1s)^2 = 4.9 m
d2 = 1/2 (9.8) (2s)^2 = 19.6 m
d3 = 1/2 (9.8) (3s)^2 = 44.1 m
d4 = 1/2 (9.8) (4s)^2 = 78.4 m
d5 = 1/2 (9.8) (5s)^2 = 122.5 m
- A constant acceleration will create a curve line (parabola).
- The slope at any given point is the speed or velocity at that instant
- The instantaneous speed is found by drawing a tangent line to any point on the curve line.
- slope = Δd / Δt
Speed vs Time graph
- Area below the line on a speed vs time graph is the distance traveled.
- Area = L * W => d = s * t = 3
s* 10 m/s= 30 m
- Straight line means constant acceleration = slope = (6 m/s) / 5 s = 1.2 m/s^2
- Initial speed =0, Distance traveled =>d = (1/2)at^2 = (1/2) (1.2)(5)^2 = 15 m
- Area = 1/2bh = (1/2)(5)(6) = 15 m
Velocity vs Time graph
- Slope is always = accelerate on a velocity vs time graph
- In this case the slope is negative, so it is decelerate.
- Slope = (0-140)/ (8-0) = - 17.5 m/s^2
- Distance = Area of the line => A = (1/2)bh = (1/2)(8)(140) = 560 m
- Distance = d = si*t + (1/2) at^2 = (140)(8) + (1/2) (-17.5) (8)^2 = 560 m
Acceleration vs Time graph
- Straight line means constant acceleration = 10 m/s^2 , but velocity is changing by the same rate each second
- Area under the line gives the change in velocity during the time interval 5 secs.
Formula:
1) d = si*t = (1/2) a*t^2 a = (2d) / t^2
2) d = (sf^2 - si^2) / 2a a = (sf^2 - si^2) / 2d
3) a = (sf - si) / t t = (sf -si) / a
_
4) s = d / t t = d / s d = s*t
_
5) s = (si +sf) /2
6) sf = si + a*t


This is very appealing, however , it is very important that will mouse click on the connection: quality statistics training
ReplyDelete